Product · Reports
Know your numbers.
Stop guessing which ad is working and which tech is booked. Live dashboards show revenue, jobs, close rate, and lead source at a glance, and answer plain-English questions without a spreadsheet.
Switch the metric to update the chart.
How it works
Three steps, then it just runs.
Live dashboards
Revenue, jobs, close rate, and ticket size update in real time as work happens.
Ask a question
Type it in plain English and get a chart back, no query editor.
Get the digest
The numbers that matter land in your inbox or Slack every morning.
What you get
Everything in reports.
Live dashboards
Revenue, booked jobs, close rate, and average ticket, updated in real time.
Lead-source ROI
See which channels and campaigns actually turn into paid jobs.
Tech & team performance
Jobs, revenue, and review scores per technician and per office.
Plain-English questions
Ask 'revenue by service this month' and get a chart, not a query editor.
Scheduled digests
The numbers that matter, in your inbox or Slack every morning.
Inside the app
Know your numbers.
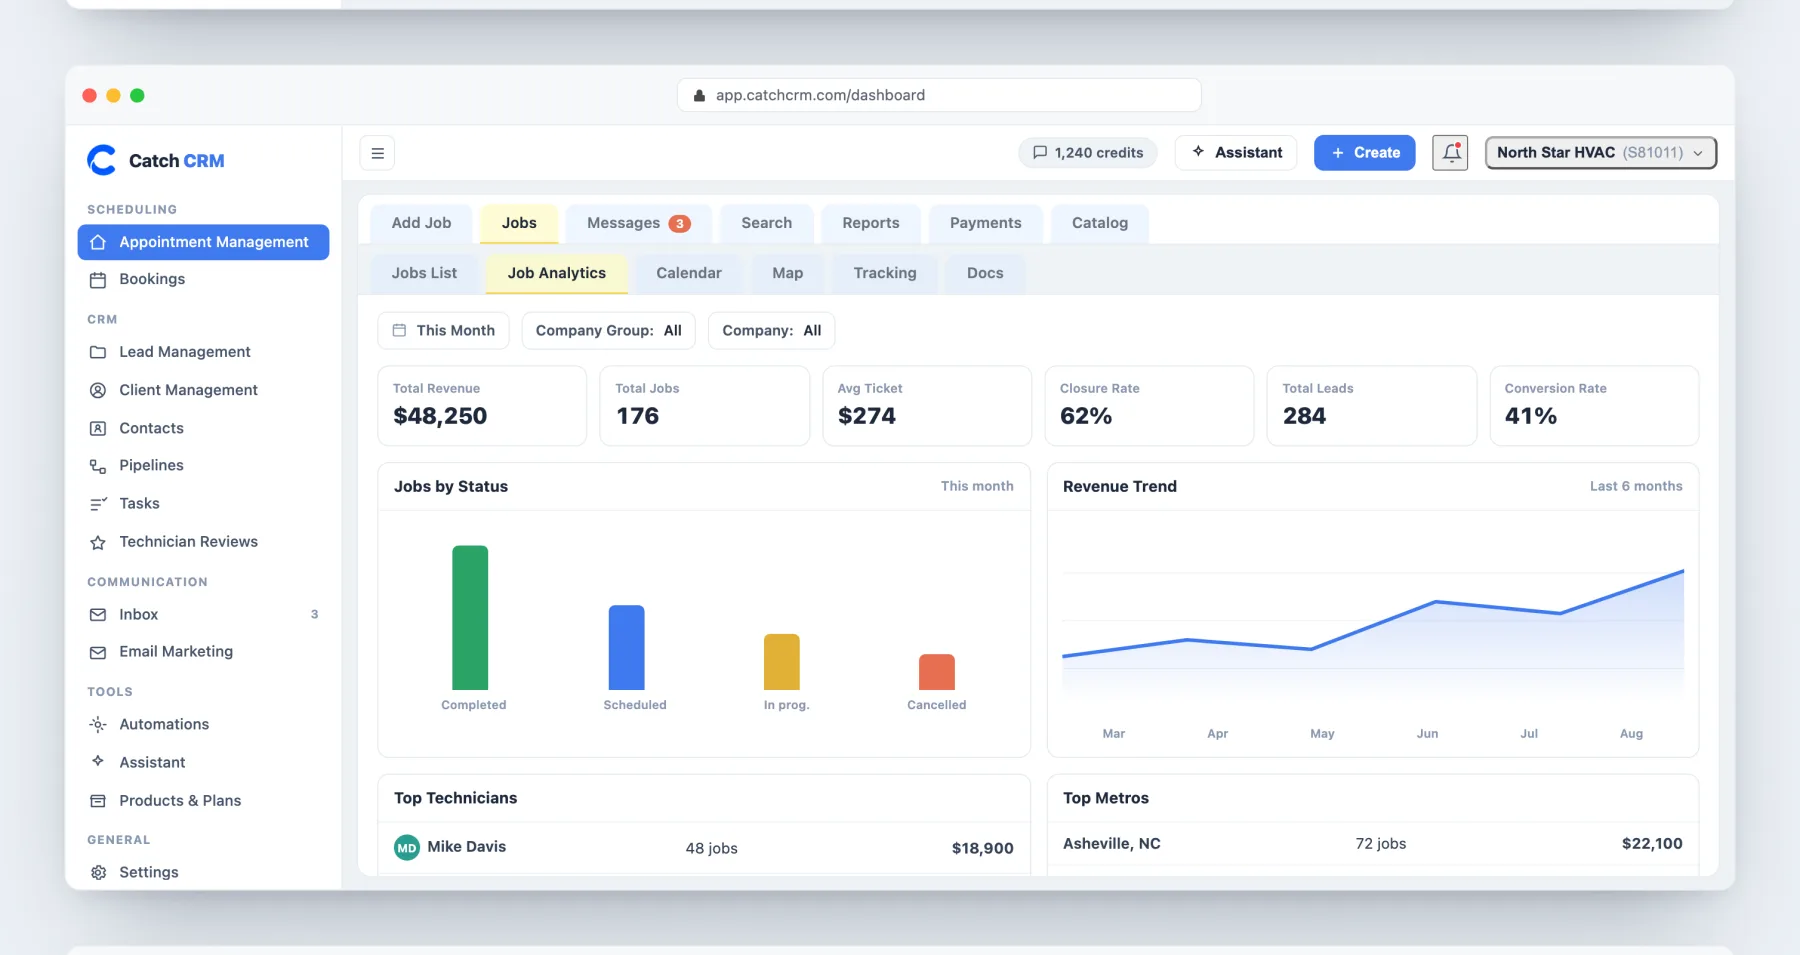
Revenue, average ticket, and close rate for the month, plus which techs and metros produced them.
More in product
See reports on your jobs.
Reports: common questions
What can I see in reports?
Revenue, jobs, lead sources, and per-tech performance, so you know which ads and crews actually make money.
Can I track ad ROI?
Yes. Tie leads to sources and see estimates, closed jobs, and cancellations by campaign.
Are AI reports included?
AI reports are included on the Business plan ($249/mo).
Do multi-brand offices get rollups?
Yes. Per-company reports plus a portfolio rollup across every brand.