

Ask most service-business owners how their Facebook ads are doing and you'll get a version of the same answer: "Pretty good, I think?"
That's not a knock, it's the honest truth, because the tools lie to you by omission. Ads Manager will happily report cost per lead all day. What it can't tell you is what actually happened to those leads: how many became estimates, how many closed, how many cancelled, and how much money came out the other end.
Let's fix that by following one real campaign, call it New Installs, all the way from ad spend to paid invoice.
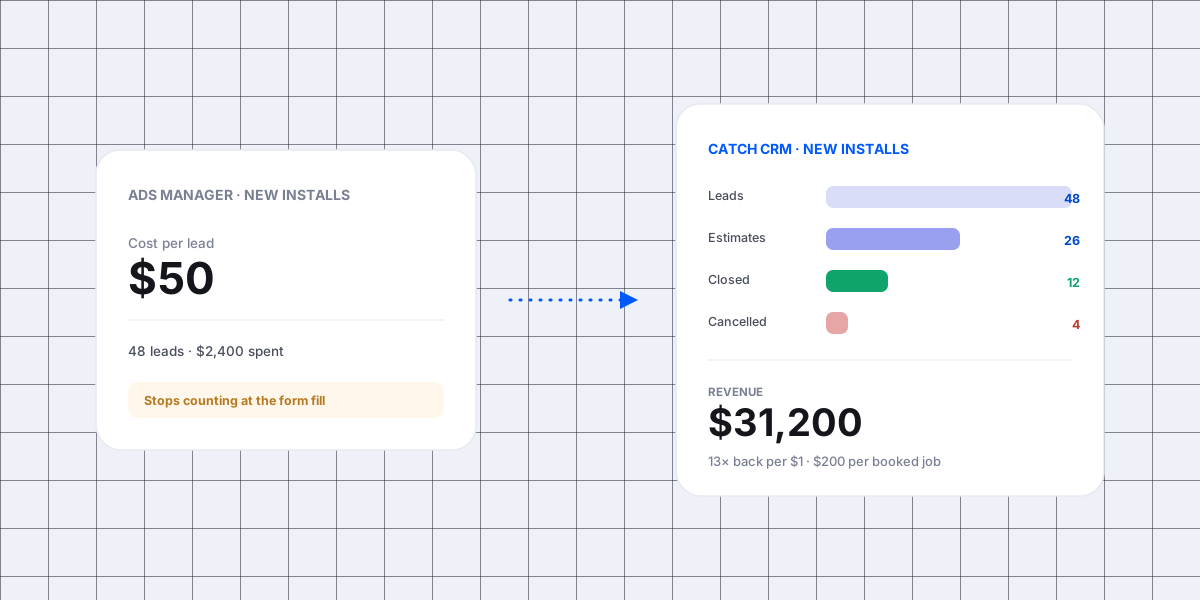
What Ads Manager actually tells you
Meta's Ads Manager is genuinely good at its job. For your New Installs campaign it'll show impressions, reach, frequency, clicks, click-through rate, cost per click, and the headline number most owners watch: cost per lead. Use those to judge your creative, your audience, and your delivery. That part is real and useful.
But look at where every one of those columns stops: the form fill. Ads Manager counts a "result" the instant someone submits their info. Whether that person booked an estimate, signed for a $9,000 system, or ghosted you, Meta has no idea. It literally cannot see past the lead.
Which means the most expensive decision you make, where to put your budget, is being made on the least complete data you have.
Cost per lead is a vanity metric
A "lead" is a form fill. It says nothing about whether the person was serious, in your service area, or ready to buy an install.
Two ad sets inside New Installs can look identical in Ads Manager, same $50 cost per lead, while one prints money and the other bleeds it:
- Ad set A brings in 24 leads at $50. Eight become installs, average ticket $2,600. That's $20,800 in revenue on $1,200 of spend.
- Ad set B brings in 24 leads at $50. One becomes an install. That's $2,600 on $1,200 of spend, barely break-even.
Same cost per lead. Wildly different businesses. If you manage to cost per lead, you'll keep feeding Ad set B because it "looks fine."
Follow New Installs down the funnel
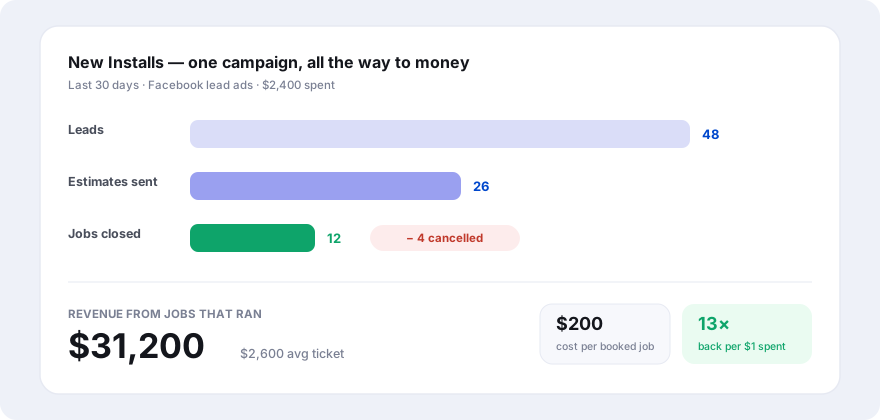
Here's where it gets useful. Take the whole campaign and watch a month of leads move all the way to money:
- 48 leads came in at $50 each, $2,400 spent.
- 26 estimates went out. (The other 22 never booked, or weren't real installs.)
- 12 jobs closed. (Fourteen estimates didn't, price, timing, or no follow-up.)
- 4 of those cancelled before the work happened.
- $31,200 in revenue from the jobs that actually ran, an average ticket of $2,600.
Suddenly every drop-off is a lever you can actually pull:
Leads → estimates
If leads aren't turning into estimates, you are losing them on speed and booking, you're not reaching them fast enough, or not getting them on the calendar. This is exactly where an autocall dialer is worth it: it rings the lead in seconds instead of hours.
Estimates → closed
Lots of estimates but few closes points at pricing, your Good/Better/Best options, or follow-up that stops after one try. It can also be the paperwork itself, since what you put on a quote or an estimate decides how easy it is for the customer to say yes. A campaign with a 20% estimate-to-close rate and one at 50% deserve very different budgets, even at the same cost per lead.
Closed → cancelled
Jobs that close and then cancel usually mean a scheduling gap, a missing deposit, or a slow start that let the customer cool off and shop around.
The revenue line
This is the only number that pays you, and now you can trace it straight back to the ad that started it.
Why the numbers never connect
The reason almost nobody has this view is structural. Your data is scattered across systems that don't talk:
- The lead shows up in Meta.
- The estimate and appointment live in your CRM or on a notepad.
- The paid invoice is somewhere else, often QuickBooks.
By the time a lead becomes revenue it has passed through three or four tools, and the thread connecting it back to the exact ad is long gone. So the owner does the only thing left to do: guess.
The four numbers that end the guessing
Once every lead carries its source all the way to the invoice, four numbers replace the guesswork:
- Cost per booked job, spend divided by jobs closed, not leads. Usually 3–5× your cost per lead, and the honest cost of a customer.
- Close rate by source, the share of each campaign's leads that actually book.
- Revenue (and profit) per ad dollar, how many dollars of booked work came back for every $1 in. This is what you scale on.
- Average ticket by source, some campaigns bring $300 repairs, some bring $9,000 installs. Same close rate, very different money.
From "I think" to "I know"
This is what Catch CRM's reporting is built to do. Because every lead is captured with its source and carried through booking, dispatch, and the paid invoice, the connection is never lost:
- Lead-source-to-revenue reporting, spend, estimates, closed jobs, cancellations, and revenue by source, campaign, city, and zip.
- Meta leads flow straight in, the Meta integration pushes Facebook and Instagram lead-ad submissions into the CRM in real time, fully attributed, and can autocall them before they scroll away. Here's how to connect Facebook lead ads to your CRM, step by step.
- A plain-English monthly breakdown, the built-in AI writes up what's working, what's not, and what to do next. No spreadsheets.
For the mechanics of ad tracking that survives browser and privacy changes, Meta's own Conversions API is the server-side backbone that keeps attribution honest, and it's built in.
The bottom line
You wouldn't run your business off a bank balance you never reconcile. Don't run your ad budget off cost per lead. Follow each campaign all the way down, leads, estimates, closed, cancelled, revenue, and the decision makes itself: pour budget into the ads that book paying jobs, and cut the ones that don't.
Want to see your real New Installs numbers on your own jobs? Get a free demo and we'll wire up the reporting with you.